WSD Financial Facts-Part 2
August 18, 2023
PART 1: INTRODUCTION
PART 2: REVENUES
WSD Revenue
Funding Gaps
Provincial Department of Education and Training
Other Funding for Student Needs – Non-provincial support
PART 3: EXPENDITURES
PART 4: FINANCIAL POSITION (BALANCE SHEET)
Part 2 - Revenues
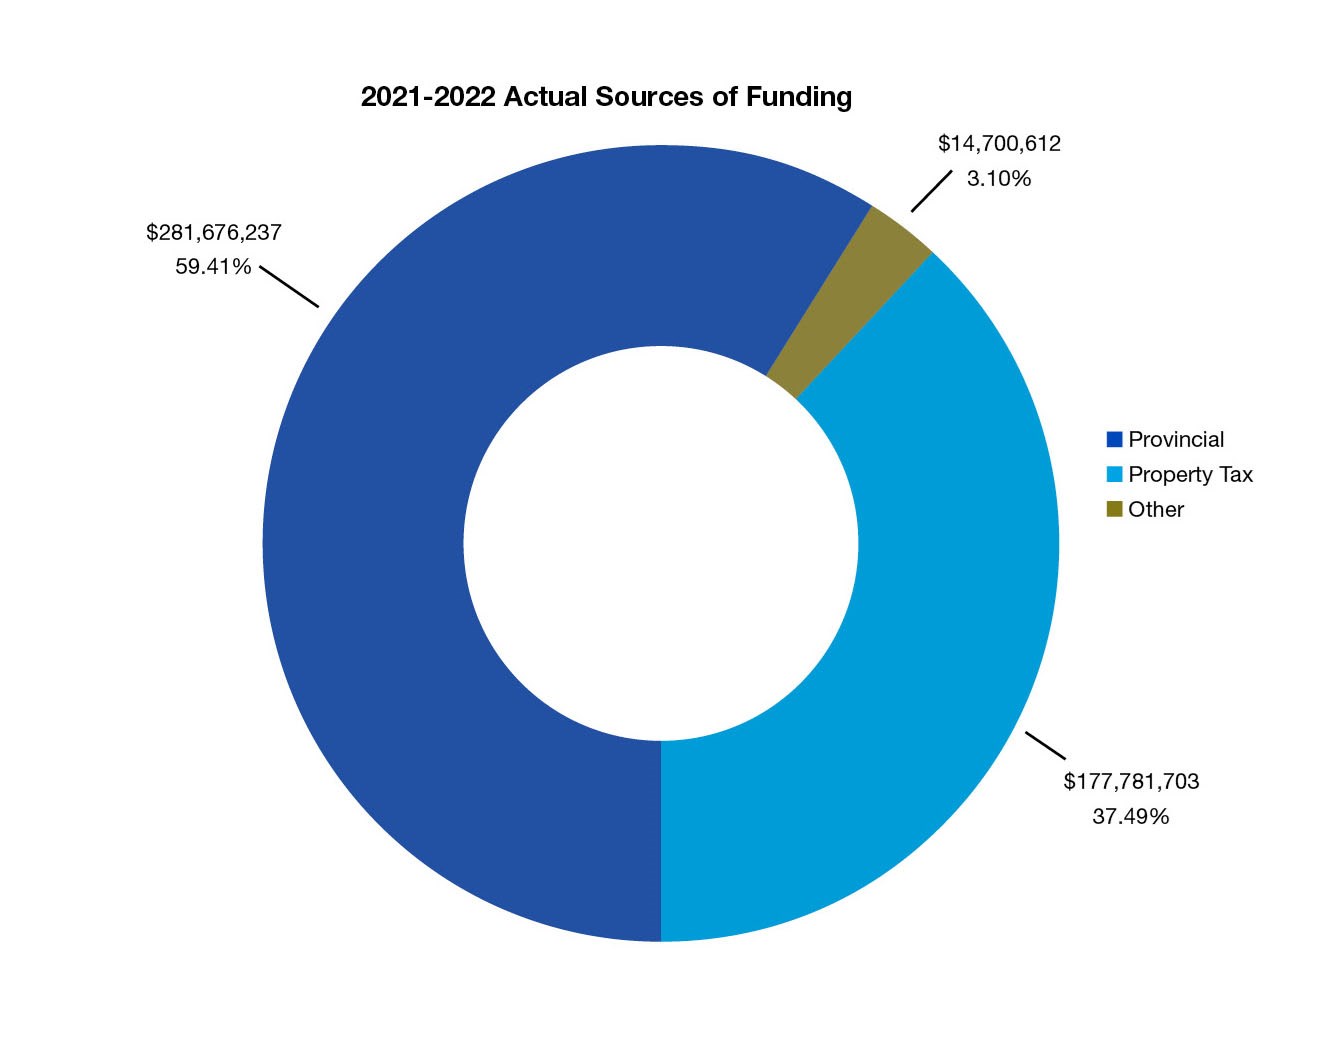
WSD Revenue
Province’s Funding of Schools Program
Provincial grants to Manitoba’s public school divisions are provided through the Funding of Schools Program (FSP). The FSP includes both operating and capital support for school divisions and is administered by the Public Schools Finance Board.
This funding, disbursed to school divisions, is intended to support the success of students in Grades K to 12. The FSP funding consists of the following components:
Base Support – includes per pupil funding for the delivery of K to 12 educational programs and services. Funding is provided for instructional support, curricular materials, information technology, library services, counselling/guidance, professional development, physical education, building occupancy and other student services.
Categorical Support – funding is available for students with supplementary needs including Transportation; English as an additional language, Indigenous and French supports; Special needs, Literacy and Numeracy; and Early Childhood Development. A complete listing of categorical funds received by WSD is included in the table below.
Equalization Support – provided to recognize the varying abilities of school divisions to meet the cost of unsupported program requirements through the property tax base of the school division. There is an additional calculation called Additional Equalization, which is provided to assist school divisions that have both higher than average tax effort and lower than average assessment per pupil.
Other Program Support – includes grants for School Buildings Support (“D” Projects), Technology Education Equipment Replacement, Skills Strategy Equipment Enhancement and other minor capital support.
Other Department of Education
Manitoba Education also provides additional revenue to offset the operating costs of WSD. Some examples include funding for: Early Years Education Initiative, Interdivision Student Services, Nursing Supports (URIS), New Schools, Healthy Schools, General Support Grant, Learning to Age 18 Coordinator, Career Development Initiative Grant and the Tax Incentive Grant.
Other Provincial Government Departments
Consists of revenue received from the Manitoba Government Reporting Entity (GRE), other than the Department of Education. Includes funding for the Adult Learning Centres.
Formula Guarantee
Support that is calculated by way of a formula.
Non-Provincial Revenue Sources
Includes Federal government, Municipal government, other school divisions, First Nations authorities, private organizations, individuals and other sources.
Property Taxation
Includes the Special Levy property tax (on a school year basis). School divisions are required to freeze their 2022 Special Levy amounts, as they did for 2021.
Funding Gaps
To the extent that provincial funding through the FSP is insufficient to cover the costs of providing programs and services, the gap created is covered through other means, primarily by a Special Levy administered by the City of Winnipeg. The gaps are described below using budgeted data.Description of | Provincial Revenue | Presumed Expenditure* | Budgeted Expenditure | Funding Gap | ||
Direct | Equalization | Total | ||||
Aboriginal Academic Achievement | 2,392,500 | 527,685 | 2,920,185 | 2,920,185 | 4,097,068 | $1,176,883 |
Adult Crossing Guards | 61,307 | 61,307 | 106,343 | 476,000 | $369,657 | |
Adult E.A.L. | 3,252,623 | 3,252,623 | 3,252,623 | 3,252,623 | $0 | |
Adult Learning Centre | 784,800 | 784,800 | 784,800 | 784,800 | $0 | |
Attendance Officers | 18,199 | 18,199 | 31,568 | 141,300 | $109,732 | |
Counselling and Guidance | 2,404,776 | 765,237 | 3,170,013 | 5,498,722 | 5,941,482 | $442,760 |
Curricular Materials | 1,738,392 | 172,246 | 1,910,638 | 1,910,638 | 1,910,638 | $0 |
District Computer Technicians | 37,016 | 37,016 | 64,208 | 287,400 | $223,192 | |
Early Childhood Development Initiative | 476,307 | 40,731 | 517,038 | 517,038 | 517,038 | $0 |
Education for Sustainable Development | 56,700 | 56,700 | 56,700 | 56,700 | $0 | |
English as an Additional Language | 2,183,565 | 341,102 | 2,524,667 | 2,524,667 | 2,648,400 | $123,733 |
French Language | 1,095,924 | 5,968,765 | 7,064,689 | 7,064,689 | 46,342,894 | $39,278,205 |
Full Day Kindergarten | 67,868 | 67,868 | 117,724 | 526,944 | $409,220 | |
Home Learning Assistants/Early School Years | 5,796 | 5,796 | 10,054 | 45,000 | $34,946 | |
Information Technology | 1,796,338 | 580,528 | 2,376,866 | 4,122,925 | 4,507,353 | $384,428 |
Inter-cultural Support Workers | 72,860 | 72,860 | 126,383 | 565,700 | $439,317 | |
International Language (Bilingual Programs) | 56,581 | 750,509 | 807,090 | 1,399,983 | 5,827,127 | $4,427,144 |
Library & Support Services Department (LSS) | 73,182 | 73,182 | 126,942 | 568,200 | $441,258 | |
Library Technical Assistants | 72,538 | 72,538 | 125,825 | 563,200 | $437,375 | |
Literacy and Numeracy | 2,432,856 | 62,365 | 2,495,221 | 2,495,221 | 2,495,221 | $0 |
Nursery | 0 | 0 | 4,703,281 | $4,703,281 | ||
Nutrition | 139,939 | 139,939 | 242,739 | 1,086,523 | $843,784 | |
Occupancy / Building | 15,126,795 | 6,984,419 | 22,111,214 | 38,354,231 | 54,228,671 | $15,874,440 |
Off Campus Programs | 39,386 | 39,386 | 68,319 | 305,800 | $237,481 | |
Performances and Programs | 15,410 | 15,410 | 26,730 | 119,650 | $92,920 | |
Professional Development | 1,129,955 | 334,472 | 1,464,427 | 2,540,203 | 2,596,916 | $56,713 |
Senior Years Technology Education | 1,589,335 | 890,906 | 2,480,241 | 2,480,241 | 6,917,206 | $4,436,965 |
Special Events | 10,304 | 10,304 | 17,873 | 80,000 | $62,127 | |
Student Support Services | $20,491,401 | 9,497,952 | $29,989,353 | 29,989,353 | 73,744,333 | $43,754,980 |
Summer School | 64,000 | 37,686 | 101,686 | 176,385 | 292,600 | $116,215 |
Therapy Services | 85,958 | 85,958 | 149,103 | 667,400 | $518,297 | |
Transportation | 1,411,950 | 942,189 | 2,354,139 | 2,354,139 | 7,315,376 | $4,961,237 |
SUB-TOTAL | 58,484,798 | 28,596,552 | 87,081,350 | 109,656,554 | 233,612,844 | 123,956,290 |
Undistributed (Remaining) | 309,459,612 | 24,498,438 | 333,958,050 | 311,382,846 | 187,426,556 | |
TOTAL | $367,944,410 | $53,094,990 | $421,039,400 | $421,039,400 | $421,039,400 | $123,956,290 |
Department of Education and Training
Department of Education and Training | 2017-18 | 2018-19 | 2019-20 | 2020-21 | 2021-22 | Annualized |
SCHOOLS FINANCE PROGRAM |
|
|
|
|
| |
(A) BASE SUPPORT |
|
|
|
|
|
|
Instructional Support | 57,113,004 | 57,199,271 | 56,853,011 | 56,407,337 | 55,832,320 | - |
Occupancy | 14,417,865 | 14,310,135 | 14,297,310 | 14,206,680 | 14,063,040 | - |
Curricular Materials | 1,786,439 | 1,745,826 | 1,648,668 | 1,756,326 | 1,738,422 | - |
Information Technology | 1,837,575 | 1,839,521 | 1,829,236 | 1,814,870 | 1,796,369 | - |
Library Services | 2,726,724 | 2,729,612 | 2,714,350 | 2,693,033 | 2,665,580 | - |
Student Services | 16,489,582 | 16,442,284 | 16,336,921 | 16,110,387 | 15,840,482 | - |
Counselling & Guidance | 2,459,979 | 2,462,585 | 2,448,815 | 2,429,584 | 2,404,817 | - |
Professional Development | 1,155,894 | 1,157,118 | 1,150,648 | 1,141,612 | 1,129,974 | - |
Physical Education (Grades 11 & 12) | 734,125 | 736,000 | 738,188 | 732,750 | 695,125 | - |
| 98,721,187 | 98,622,352 | 98,017,147 | 97,292,581 | 96,166,129 | -0.65% |
(B) CATEGORICAL |
|
|
|
|
|
|
Special Needs: |
|
|
|
|
|
|
- Coordinator & Clinicians | 2,222,873 | 2,225,228 | 2,212,785 | 2,195,408 | 2,173,028 | - |
- Level II | 7,412,850 | 7,412,850 | 7,412,850 | 7,412,850 | 7,412,850 | - |
- Level III | 7,065,872 | 6,869,363 | 6,943,318 | 6,943,318 | 6,943,318 | - |
Transportation | 1,335,688 | 1,388,893 | 1,415,674 | 1,413,870 | 1,412,030 | - |
Senior Years Technology Education | 1,625,580 | 1,545,913 | 1,589,335 | 1,589,335 | 1,589,335 | - |
English as an Additional Language | 2,990,690 | 2,528,260 | 2,243,190 | 2,183,565 | 2,186,065 | - |
Indigenous Academic Achievement | 2,379,400 | 2,379,400 | 2,379,400 | 2,392,500 | 2,371,020 | - |
Indigenous & International Languages | 71,950 | 55,443 | 56,581 | 56,581 | 56,581 | - |
French Language Education | 932,603 | 1,025,117 | 1,045,011 | 1,095,924 | 991,998 | - |
Enrolment Change Support | 94,990 | - | 471,488 | 657,565 | 845,666 | - |
Early Childhood Development Initiative | 509,576 | 522,392 | 501,043 | 471,370 | 476,683 | - |
Literacy and Numeracy | 2,487,064 | 2,490,576 | 2,477,804 | 2,456,768 | 2,432,896 | - |
Education for Sustainable Development | 56,000 | 56,000 | 56,000 | 56,000 | 56,700 | - |
| 29,185,136 | 28,499,435 | 28,804,479 | 28,925,054 | 28,948,170 | -0.20% |
(C) EQUALIZATION SUPPORT |
|
|
|
|
|
|
Equalization | 51,626,583 | 51,785,048 | 53,015,289 | 58,217,529 | 50,999,114 | - |
Additional Equalization | 4,863,665 | 4,863,665 | 4,863,665 | - | - | - |
| 55,008,311 | 56,490,248 | 56,648,713 | 57,878,954 | 50,999,114 | -2.50% |
(D) OTHER SFP SUPPORT |
|
|
|
|
|
|
Formula Guarantee | - | - | - | - | 4,502,946 | |
School Building Support “D” Projects | 977,040 | 970,560 | 967,380 | 963,720 | 960,300 | - |
Technology Education Equip. Replacement | 385,500 | 385,500 | 385,500 | 385,500 | 385,500 | - |
Skills Strategy Equip. Enhancement | 142,592 | 390,227 | 429,109 | 307,103 | 204,767 | - |
Finalization of Prior Year Support | 6,339 | -36,135 | 26,467 | 55,538 | -116,577 |
|
TOTAL SCHOOLS | 185,908,042 | 185,480,652 | 186,509,036 | 186,147,024 | 182,050,349 | 0.50% |
Department of Education and Training | 2017-18 | 2018-19 | 2019-20 | 2020-21 | 2021-22 | Annualized |
(E) OTHER PROVINCIAL SUPPORT | ||||||
Education Property Tax Credit | 30,930,809 | 30,863,745 | 30,363,089 | 25,037,992 | 19,346,044 | - |
Special needs/Autism | 605,261 | 591,576 | 315,993 | 281,052 | 288,759 | - |
General Support Grant | 6,775,693 | 6,568,692 | 6,227,989 | 6,260,633 | 6,344,661 | - |
Property Tax Offset Grant | - | - | - | - | 3,987,770 | - |
Specials Needs Additional Funding | - | - | - | - | 961,799 | - |
Wage Assistance | - | - | - | - | 10,398,315 | - |
Supplimental COVID Allocation | - | - | - | - | 3,216,782 | - |
Ventilation Upgrade Grant | - | - | - | - | 2,510,147 | - |
Previous Year COVID Support | - | - | - | - | 2,149,293 | - |
Lead Testing | - | - | - | - | 87,414 | - |
Institutional Programs | 3,405,148 | 3,443,025 | 3,388,065 | 3,600,867 | 3,409,408 | - |
Special Grant | 3,500,000 | 3,500,000 | 3,500,000 | 3,500,000 | 3,500,000 | - |
Sub Fees | 25,601 | 48,248 | 21,141 | 0 | 0 | - |
Nursing Support (URIS) | 162,392 | 177,372 | 259,409 | 175,858 | 123,047 | - |
Property Tax Rebates | - | - | - | 9,117 | 18,795 | - |
Community Schools Partnership | 925,000 | 925,000 | 1,060,000 | 1,060,000 | 1,060,000 | - |
Tax Incentive Grant | 8,529,940 | 6,946,148 | 5,364,621 | 4,731,529 | 4,729,350 | - |
Healthy Schools Initiative | 73,483 | 73,456 | 73,172 | 72,451 | 65,966 | - |
Learning to Age 18 Coordinator | 153,071 | 158,430 | 156,180 | 154,110 | 150,765 | - |
Early Years Enhancement Grant | 3,197,395 | 3,197,395 | 3,197,395 | 3,197,395 | 3,197,396 | - |
Career Development Initiative | 251,430 | 250,920 | 248,064 | 247,401 | 243,643 | - |
New School Grant (Dept Ed.) | - | - | - | 465,000 | 0 | - |
Syrian Refugee | 625,660 | - | - | - | - | - |
Shared Services Grant | - | 599,582 | 610,465 | 601,596 | 626,183 | - |
Inner City Science | - | 57,318 | - | - | - | - |
Directed Grants | - | 1,535,469 | 1,672,542 | 1,939,169 | 2,255,985 | - |
French Language Revitalization Grant | - | - | 10,520 | 11,017 | - | - |
Miscellaneous | - | - | - | - | - | - |
TOTAL OTHER PROVINCIAL SUPPORT | 58,535,223 | 58,936,376 | 56,468,644 | 64,859,234 | 68,671,522 | 4.07% |
(F) DEPARTMENT OF EDUCATION |
|
|
|
|
|
|
Adult Learning Centres (ALC) | 790,786 | 811,302 | 802,678 | 788,163 | 1,181,739 | - |
School Resource Officer | - | - | - | - | - | - |
TOTAL DEPARTMENT OF EDUCATION SUPPORT | 790,786 | 811,302 | 802,678 | 788,163 | 1,181,739 | 10.56% |
(G) DEBT SERVICING | 13,177,132 | 13,848,207 | 14,980,234 | 16,658,204 | 17,636,720 | 7.56% |
(H) DEBENTURE FINALIZATIONS | - | 37,358 | 61,134 | 401,929 | 179,182 | 100% |
SUB-TOTAL | 258,411,183 | 259,113,895 | 258,821,726 | 255,340,506 | 269,719,512 | 1.08% |
(I) SAFE SCHOOLS FUND | - | - | - | 13,514,047 | 11,956,725 | - |
TOTAL PROVINCIAL GOVERNMENT | 258,411,183 | 259,113,895 | 258,821,726 | 268,854,553 | 281,676,237 | 2.18% |
NON-PROVINCIAL SUPPORT | 2017-18 | 2018-19 | 2019-20 | 2020-21 | 2021-22 | Annualized |
FEDERAL GOVERNMENT |
|
|
|
|
|
|
EAL Adults | 4,253,313 | 4,393,748 | 3,709,796 | 3,575,023 | 3,176,953 | - |
Climate Action Incentive | - | - | - | 834,070 | 9,091 | - |
Directed Grants | - | 206,850 | 185,939 | - | - | - |
Jordan’s Principle | - | - | - | 101,470 | 852,823 | |
TOTAL FEDERAL SUPPORT | 4,253,313 | 4,600,598 | 3,895,735 | 4,510,563 | 4,038,867 | -1.29% |
MUNICIPAL |
|
|
|
|
|
|
City Special Levy | 150,753,851 | 156,208,907 | 162,171,466 | 172,087,576 | 177,781,703 | - |
Other | 88,762 | 101,488 | 66,970 | - | 1,080 | - |
TOTAL MUNICIPAL SUPPORT | 150,842,613 | 156,310,395 | 162,238,436 | 172,087,576 | 177,782,783 | 4.19% |
OTHER SCHOOL DIVISIONS |
|
|
|
|
|
|
Residual Fees | 275,628 | 191,875 | 114,526 | 62,615 | 121,999 | - |
School of Choice | 2,312,700 | 2,184,000 | 2,165,800 | 2,141,750 | 1,999,855 | - |
TOTAL OTHER SCHOOL DIVISION SUPPORT | 2,588,328 | 2,375,875 | 2,280,326 | 2,204,365 | 2,121,854 | -4.85% |
Indigenous EDUCATION AUTHORITIES |
|
|
|
| ||
Tuition | 2,048,814 | 2,022,050 | 1,741,360 | 1,599,667 | 1,906,706 | - |
TOTAL Indigenous EDUCATION SUPPORT | 2,048,814 | 2,022,050 | 1,741,360 | 1,599,667 | 1,906,706 | -1.78% |
OTHER SOURCES |
|
|
|
|
|
|
Tuition | 176,935 | 233,986 | 155,325 | 112,283 | 162,620 | - |
Non-Resident Tuition | 428,665 | 1,176,380 | 1,585,825 | 614,838 | 1,222,475 | - |
Transportation | 1,188 | 8,383 | 4,754 | 290 | 5,860 | - |
Food Services | 116,334 | 139,308 | 127,032 | 71,307 | 136,811 | - |
Grants | 1,190,200 | 1,126,213 | 106,298 | 418,937 | 355,680 | - |
In vestment Income | - | - | - | 16,273 | 24,100 | - |
Interest Income | 211,083 | 459,959 | 566,873 | 215,437 | 277,862 | - |
Other Special Purpose Funds | 248,495 | 222,455 | 200,317 | 1,069,346 | -222,629 | - |
School Generated Funds | 3,420,788 | 3,261,067 | 2,566,403 | 1,686,552 | 2,935,661 | - |
School Rentals | 361,671 | 382,398 | 405,461 | 315,624 | 641,364 | - |
School Use Permits | 158,220 | 171,175 | 192,105 | 0 | 0 | - |
Shop Material Sales | 125,424 | 195,910 | 70,736 | 71,692 | 53,596 | - |
Sub Wages | 61,491 | 69,849 | 49,582 | 23,238 | 69,771 | - |
Misc. Income (Recoveries) | 188,152 | 169,306 | 100,810 | 267,207 | 243,989 | - |
Directed Grants | - | 352,897 | 186,210 | 291,733 | 554,086 | |
Gain (loss) on disposal | 19,194 | 16,500 | -8,567 | 4,000 | 170,859 | - |
Food Program Initiative | - | - | 138,681 | 5,915 | 0 | |
TOTAL OTHER SOURCES | 6,707,840 | 7,985,786 | 6,447,845 | 5,247,672 | 6,632,105 | -0.28% |
GRAND TOTAL | 424,852,091 | 432,408,599 | 435,425,434 | 454,504,395 | 474,158,552 | 2.78% |
Non-provincial support
NON-PROVINCIAL SUPPORT | 2017-18 | 2018-19 | 2019-20 | 2020-21 | 2021-22 | Annualized |
FEDERAL GOVERNMENT |
|
|
|
|
|
|
EAL Adults | 4,253,313 | 4,393,748 | 3,709,796 | 3,575,023 | 3,176,953 | - |
Climate Action Incentive | - | - | - | 834,070 | 9,091 | - |
Directed Grants | - | 206,850 | 185,939 | - | - | - |
Jordan’s Principle | - | - | - | 101,470 | 852,823 | |
TOTAL FEDERAL SUPPORT | 4,253,313 | 4,600,598 | 3,895,735 | 4,510,563 | 4,038,867 | -1.29% |
MUNICIPAL |
|
|
|
|
|
|
City Special Levy | 150,753,851 | 156,208,907 | 162,171,466 | 172,087,576 | 177,781,703 | - |
Other | 88,762 | 101,488 | 66,970 | - | 1,080 | - |
TOTAL MUNICIPAL SUPPORT | 150,842,613 | 156,310,395 | 162,238,436 | 172,087,576 | 177,782,783 | 4.19% |
OTHER SCHOOL DIVISIONS |
|
|
|
|
|
|
Residual Fees | 275,628 | 191,875 | 114,526 | 62,615 | 121,999 | - |
School of Choice | 2,312,700 | 2,184,000 | 2,165,800 | 2,141,750 | 1,999,855 | - |
TOTAL OTHER SCHOOL DIVISION SUPPORT | 2,588,328 | 2,375,875 | 2,280,326 | 2,204,365 | 2,121,854 | -4.85% |
Indigenous EDUCATION AUTHORITIES |
|
|
|
| ||
Tuition | 2,048,814 | 2,022,050 | 1,741,360 | 1,599,667 | 1,906,706 | - |
TOTAL Indigenous EDUCATION SUPPORT | 2,048,814 | 2,022,050 | 1,741,360 | 1,599,667 | 1,906,706 | -1.78% |
OTHER SOURCES |
|
|
|
|
|
|
Tuition | 176,935 | 233,986 | 155,325 | 112,283 | 162,620 | - |
Non-Resident Tuition | 428,665 | 1,176,380 | 1,585,825 | 614,838 | 1,222,475 | - |
Transportation | 1,188 | 8,383 | 4,754 | 290 | 5,860 | - |
Food Services | 116,334 | 139,308 | 127,032 | 71,307 | 136,811 | - |
Grants | 1,190,200 | 1,126,213 | 106,298 | 418,937 | 355,680 | - |
In vestment Income | - | - | - | 16,273 | 24,100 | - |
Interest Income | 211,083 | 459,959 | 566,873 | 215,437 | 277,862 | - |
Other Special Purpose Funds | 248,495 | 222,455 | 200,317 | 1,069,346 | -222,629 | - |
School Generated Funds | 3,420,788 | 3,261,067 | 2,566,403 | 1,686,552 | 2,935,661 | - |
School Rentals | 361,671 | 382,398 | 405,461 | 315,624 | 641,364 | - |
School Use Permits | 158,220 | 171,175 | 192,105 | 0 | 0 | - |
Shop Material Sales | 125,424 | 195,910 | 70,736 | 71,692 | 53,596 | - |
Sub Wages | 61,491 | 69,849 | 49,582 | 23,238 | 69,771 | - |
Misc. Income (Recoveries) | 188,152 | 169,306 | 100,810 | 267,207 | 243,989 | - |
Directed Grants | - | 352,897 | 186,210 | 291,733 | 554,086 | |
Gain (loss) on disposal | 19,194 | 16,500 | -8,567 | 4,000 | 170,859 | - |
Food Program Initiative | - | - | 138,681 | 5,915 | 0 | |
TOTAL OTHER SOURCES | 6,707,840 | 7,985,786 | 6,447,845 | 5,247,672 | 6,632,105 | -0.28% |
GRAND TOTAL | 424,852,091 | 432,408,599 | 435,425,434 | 454,504,395 | 474,158,552 | 2.78% |