
WSD Financial Facts
August 18, 2023
PART 1: INTRODUCTION
Introduction
WSD Student Demographics
Financial and Statistical Information
Enrolment Trends
PART 2: REVENUES
PART 3: EXPENDITURES
PART 4: FINANCIAL POSITION (BALANCE SHEET)
REVENUE & EXPENDITURE/BALANCE SHEET TRENDS
Part 1 - Introduction
Winnipeg School Division provides a learning environment which fosters the growth of each student’s potential and provides equitable opportunity to develop the knowledge, skills, and values necessary for meaningful participation in a global and diverse society.
Our vision is for current and future students/staff learning and working within Winnipeg School Division to be: Engaged, Confident, Inspired, and Successful Learners.
School divisions in Manitoba are required to submit a balanced budget to the Provincial Department of Education and Training by the end of March each year. Winnipeg School Division views public consultations as an important part of the budget process. While budget input is encouraged throughout the year, starting in November, WSD Board of Trustees make a series of presentations at area based forums to create a general understanding of the budget, funding sources and taxation, including an overview of the anticipated challenges in developing a sustainable budget for programs and services. Interested parties, such as parent council groups, are encouraged to share their priorities.
The Board of Trustees, through the Finance and Personnel Committee, reviews the feedback from these consultations, receives information from the Province on public schools funding for the coming year, and then develops a Draft Budget. The Draft Budget is posted and a second series of community consultations is held through February before a Final Budget is developed and presented to the Province.
The information in this document provides background on WSD financial facts. Included are the many and diverse aspects of Winnipeg School Division that the Board of Trustees must take into consideration in order to draft a sustainable budget.
WSD Student Demographics
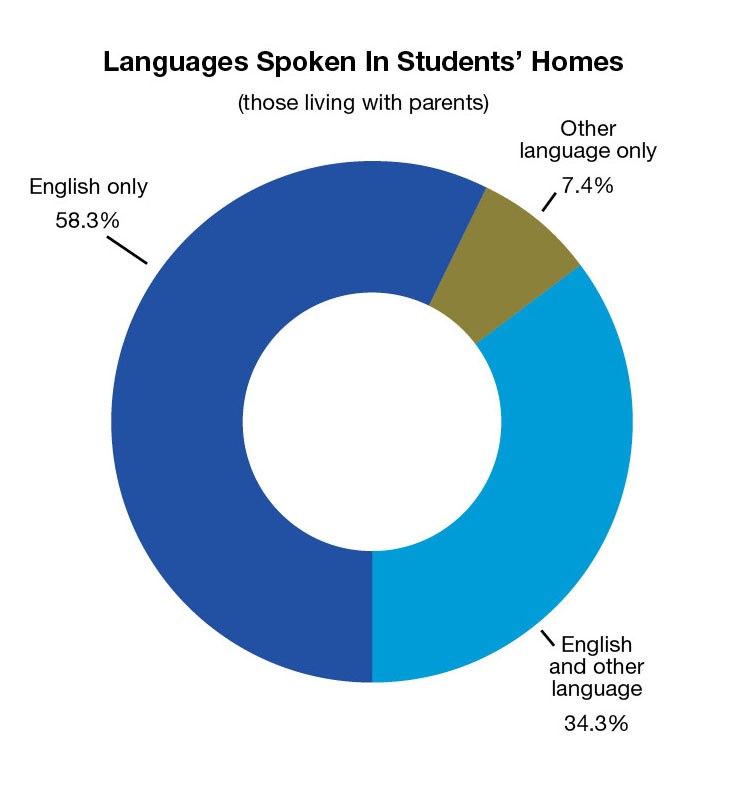
Languages Spoken at Home
- In 2021/22, English was the only language spoken in 58.3% of homes. No English was spoken in the homes of 2,016 students (7.4%).
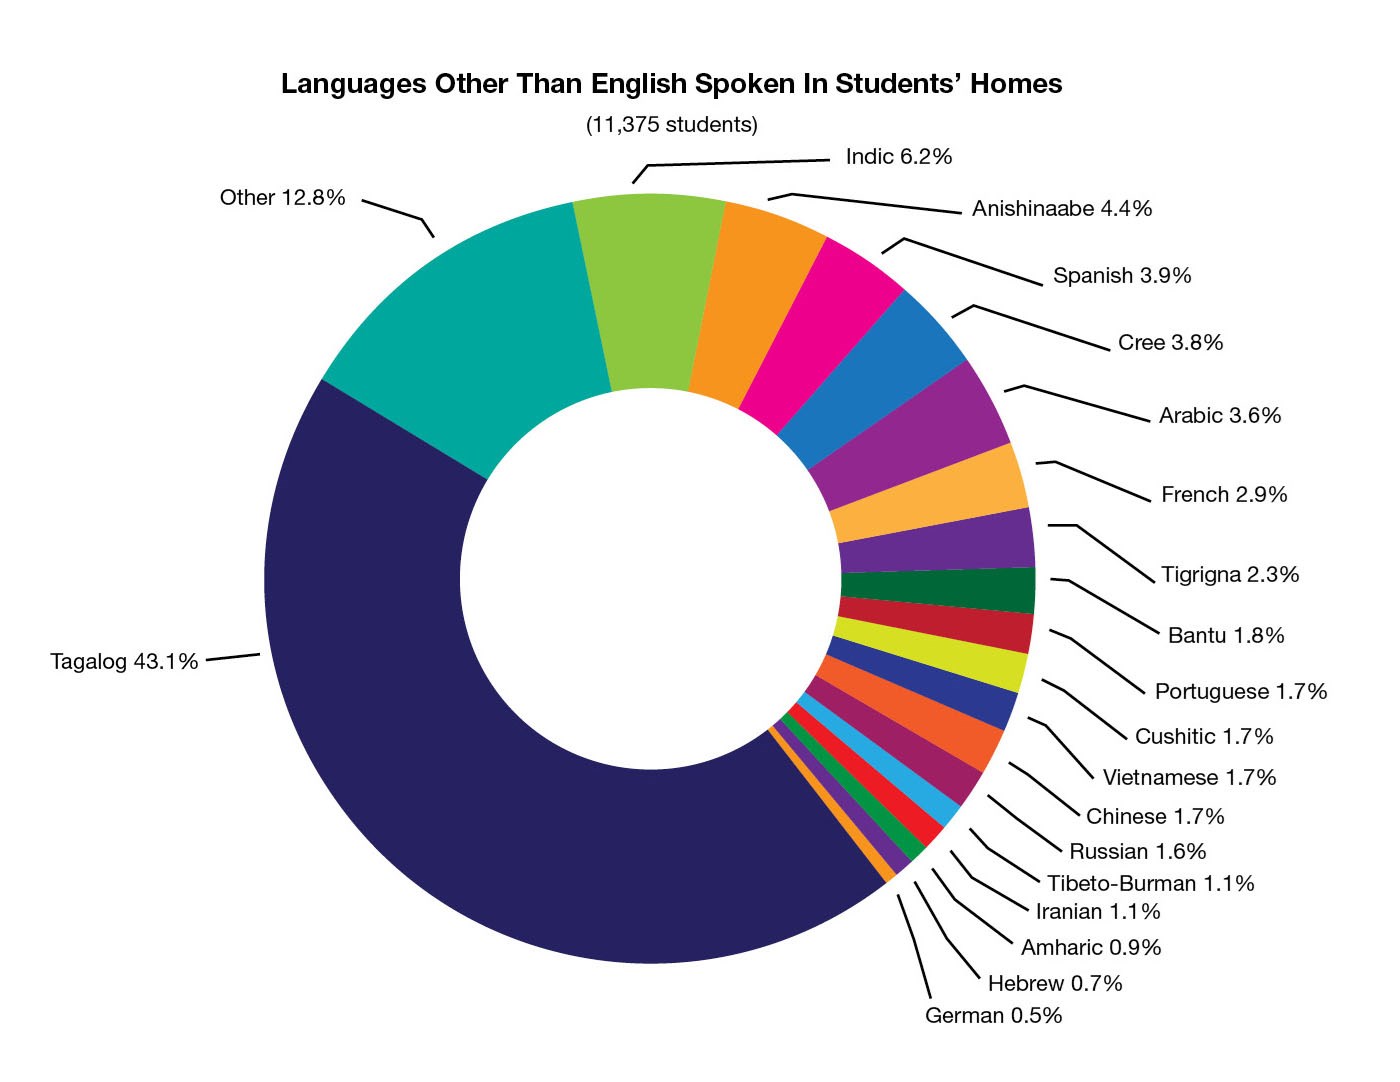
- The five most frequently reported languages, other than English, spoken in students’ homes were Tagalog, Indic, Anishinaabe, Spanish and Cree.
WSD Student Demographics
Student Immigration, English as an Additional Language – EAL, & Aboriginal Students
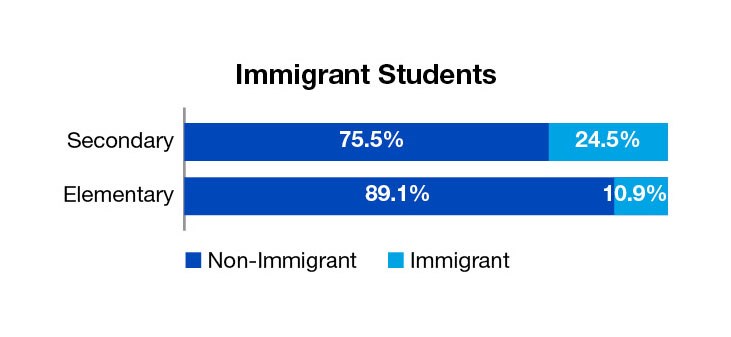
- In 2021/22, 17.2% of the Gr. N-12 students living with their parents were immigrants or refugees. The percentage was higher in secondary grades (7-12) than elementary grades (N-6).
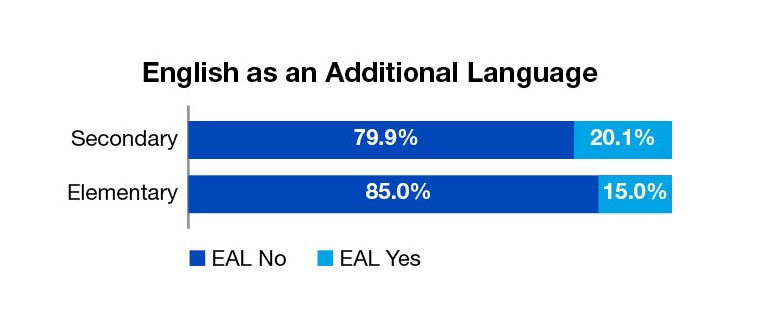
- EAL students are identified starting in Grade 1. 17.7% of Gr. 1-12 students were identified as EAL. The percentage was higher in secondary grades (7-12) than elementary grades (N-6). As per Provincial guidelines, EAL students are not identified until the spring of their kindergarten year, therefore Nursery and Kindergarten students are excluded from this calculation.
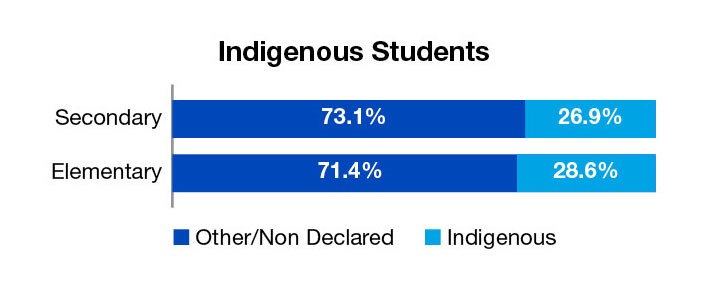
- Overall, 26.7% of theOverall, 27.8% of the students in Gr. N-12 living with their parents/guardians self-declared themselves as Indigenous or were band sponsored students. Percentages were very similar between Elementary grades and Secondary grades.
*All the information is based on our September 30th, 2020 student file.
Financial and Statistical Information
WSD Facts
Grades | Number of Schools | |
Elementary | N - 6 | 45 |
Elementary | N - 8 | 12 |
Elementary | N - 9 | 3 |
Junior High | 7 - 8 | 1 |
Junior High | 7 - 9 | 4 |
Secondary | 7 - 12 | 5 |
Secondary | 9 - 12 | 9 |
Adult | 12 | 1 |
Total Number of Schools | 80 | |
Other Administrative Buildings | 7 |
2021-22 Actual | |
Total Operating Expenses | $444,823,564 |
Total Capital Expenses | 19,683,236 |
Total Enrolment | 29,511 |
Total Budgeted Teachers | 2,182.03 |
Total Budgeted Educational Assistants | 1,183.31 |
Total Budgeted Principals | 119.50 |
Total Budgeted School Office Clerical | 149.38 |
Total Budgeted Caretakers | 319 |
School | Grades | School | Grades | School | Grades |
Andrew Mynarski School | 7-9 | Hugh John Macdonald School | 7-9 | R.B. Russell Vocational High School | 9-12 |
Argyle Alternative High School | 10-12 | Inkster School | N-6 | Ralph Brown School | N-8 |
Brock Corydon School | N-6 | Isaac Brock School | N-9 | River Elm | N-6 |
Carpathia School | N-6 | Isaac Newton School | 7-9 | École River Heights School | 7-8 |
Champlain School | N-6 | École J.B. Mitchell School | N-6 | École Riverview School | N-6 |
Children of the Earth High School | 9-12 | John M. King School | N-6 | École Robert H. Smith School | N-6 |
Churchill High School | 7-12 | Keewatin Prairie Community School | N-9 | Robertson School | N-6 |
Clifton School | N-6 | École Secondaire Kelvin High School | 9-12 | Rockwood School | N-6 |
Collège Churchill | 7-12 | Kent Road School | N-6 | École Sacré-Coeur | N-8 |
Daniel McIntyre High School | 9-12 | King Edward School | N-6 | Sargent Park School | N-9 |
David Livingstone School | N-8 | École Lansdowne School | N-8 | Shaughnessy Park School | N-8 |
Dufferin School | N-6 | École Laura Secord School | N-6 | École Sir William Osler | N-6 |
Earl Grey School | N-8 | École LaVérendrye | N-6 | Sisler High School | 9-12 |
Elmwood High School | 7-12 | Lord Nelson School | N-6 | Sister MacNamara School | N-6 |
Faraday School | N-6 | Lord Roberts School | N-6 | St. John's High School | 7-12 |
Fort Rouge School | N-6 | Lord Selkirk School | N-6 | École Stanley Knowles School | N-8 |
École Garden Grove School | N-6 | Luxton School | N-6 | Strathcona School | N-6 |
General Wolfe School | 7-9 | Machray School | N-6 | Technical Vocational High School | 9-12 |
École George V School | N-8 | Meadows West School | N-8 | Tyndall Park School | N-6 |
Gladstone School | N-6 | Montrose School | N-6 | École Victoria-Albert School | N-6 |
Glenelm School | N-6 | Mulvey School | N-6 | École Waterford Springs | N-8 |
Gordon Bell High School | 7-12 | Niji Mahkwa School | N-8 | Wellington School | N-6 |
Grant Park High School | 7-12 | Norquay School | N-6 | Weston School | N-6 |
Greenway School | N-6 | Pinkham School | N-6 | William Whyte School | N-8 |
Grosvenor School | N-6 | Prairie Rose School | N-6 | Winnipeg Adult Ed. Centre | 12 |
Harrow School | N-6 | Principal Sparling School | N-6 |
Enrolment Trends
In 2021/22 the WSD represented approximately 16.0% of the province of Manitoba’s total N-12 enrolment. The WSD N-12 enrolment has decreased 1.8% since 2017/18. There should be growth over the next few years driven by immigration.
N-12 Enrolment – Including Ungraded Special Education |
|
|
|
|
| Enrolment Change Since 2017 | Annualized |
WSD N to 12 | 33,231 | 33,093 | 32,743 | 29,595 | 29,511 | -3,720 | -2.80% |
Manitoba N to 12 | 187,036 | 188,744 | 190,114 | 181,078 | 184,258 | -2,778 | -0.37% |
WSD % Of Total Provincial Enrolment N to 12 | 17.8% | 17.5% | 17.2% | 16.3% | 16.0% | -1.8% | -2.53% |
WSD K-12 | 31,446 | 31,359 | 31,050 | 28,461 | 28,268 | -3,178 | -2.53% |
Manitoba K-12 | 184,709 | 186,521 | 187,894 | 179,876 | 182,533 | -2,176 | -0.29% |
WSD % Of Total Provincial Enrolment K-12 | 17.0% | 16.8% | 16.5% | 15.8% | 15.5% | -1.5% | -2.21% |
Since 2017/18 the WSD enrolment has seen a downward trend. The FTE figures in these tables do not count our full day kindergarten (FDK) as full time students because the students are only funded half time by the Province. In 2017/18 we had 211 FDK students, in 2018/19 we had 215, in 2019/20 we had 200, in 2020/21 we had 163, and in 2021/22 we had 191 FDK students.
WSD Enrolment |
|
|
|
|
| Enrolment Change Since 2016 | Annualized |
Elementary N-6 | 17,928 | 17,961 | 17,676 | 15,524 | 15,698 | -2,230 | -3.11% |
Secondary 7-12 | 14,966 | 14,875 | 14,815 | 13,877 | 13,648 | -1,318 | -2.20% |
Ungraded Special Education – Elementary & Secondary | 337 | 257 | 252 | 194 | 165 | -172 | -12.76% |
Total | 33,231 | 33,093 | 32,743 | 29,595 | 29,511 | -3,720 | -2.80% |
The enrolment reported here is the provincially posted total number of pupils attending school on September 30th.
Enrolment statistics contained herein are not representative of the number of pupils eligible for provincial funding.
Special Education / Inclusion Support Services
Based on WSD’s September 30th enrolment figures, enrolment in special education programs has been on a downward trend over the past five years, with a decrease in both elementary and secondary grades. The WSD does not receive provincial funding for all of the students for which it provides special education services.
Special Education Enrolment* |
|
|
|
|
| Enrolment Change Since 2016 | Annualized |
Elementary | 819 | 742 | 795 | 726 | 535 | -284 | -8.67% |
Secondary | 873 | 767 | 776 | 750 | 656 | -217 | -6.21% |
Total | 1,692 | 1,509 | 1,571 | 1,476 | 1,191 | -501 | -7.40% |
* The enrolment in this table is based on the Division’s September 30th enrolment and includes any student who had a special education program designation. These students were not necessarily funded students. Elementary grades include Elementary Ungraded students and Secondary includes Junior and Senior Ungraded students.